From modern programming languages and IDEs you may be used to things like stack trace that will show you stack of all the called objects and functions from the bottom until the place of bug or call stack which in case of pausing the code execution will show where exactly in the code you are right now.
*stack trace is just call stack in time of buggy code execution
A little step into debugging
Let’s say you have carefully placed the null pointer exception, out of bounds, zero division or other coding masterpiece somewhere in your code and it just got executed. For the computer this is no-go and it will stop your program. Modern IDEs will dump stack trace on you and you can easily find the problematic code. But in TwinCAT it is not so easy! Or is it?
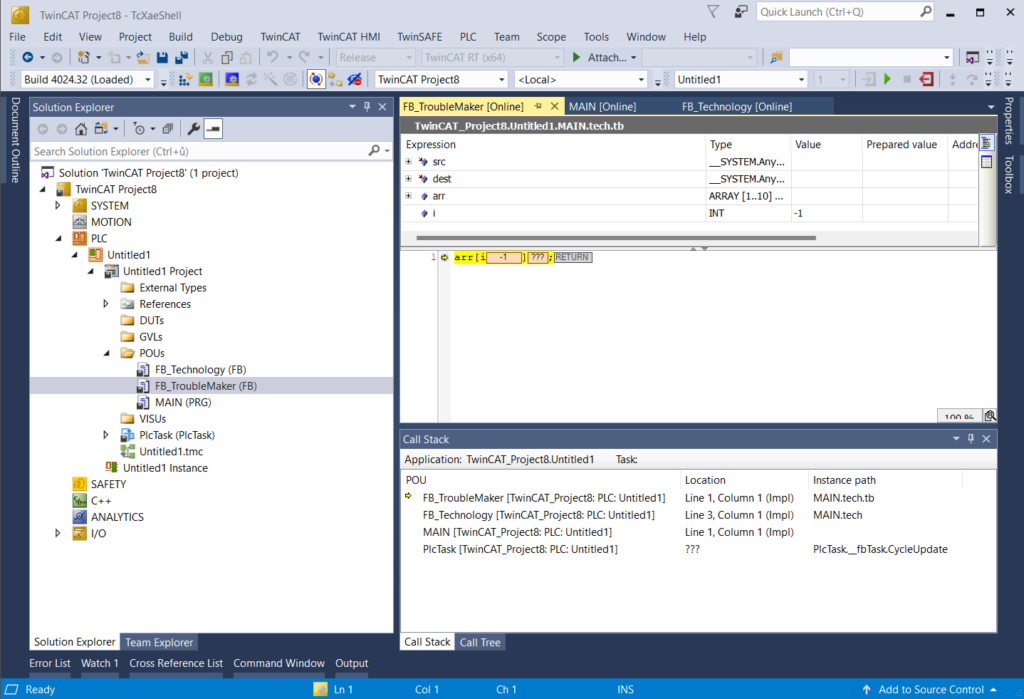
When you get TwinCAT’s runtime into yellow ![]() icon, the program execution will stop at the problematic line. What many people do not know is that you can now Login into PLC and see the exact place where the problem occurs and see all the values just like you would place a breakpoint here.
icon, the program execution will stop at the problematic line. What many people do not know is that you can now Login into PLC and see the exact place where the problem occurs and see all the values just like you would place a breakpoint here.
Other use case would be where you have no error but you just want to see where is your function executed.
Either way we have stopped code execution. In this case you may display Call Stack window which will show you the desired call stack.
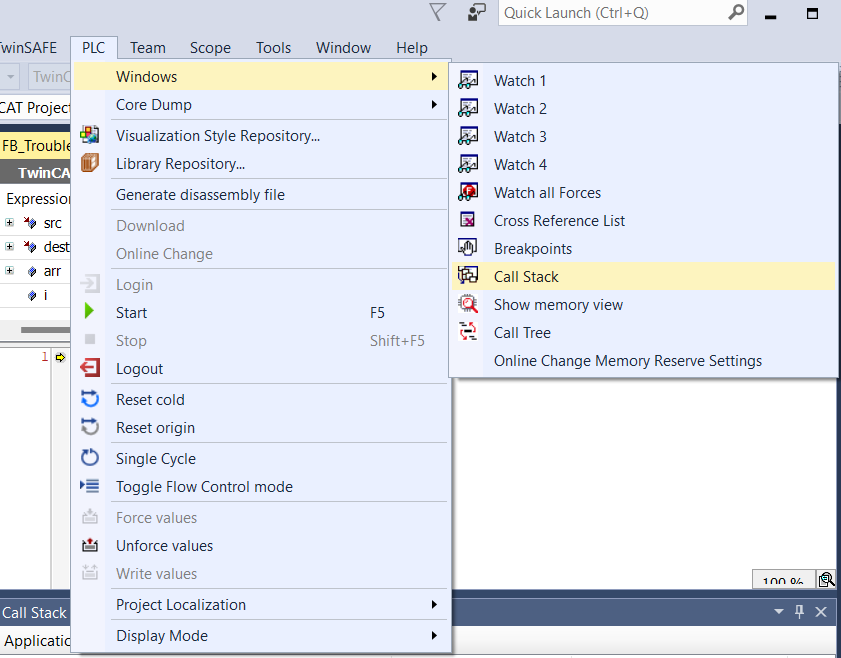
Where to find it?
Is it actaully good for something?
“But there is always path to the currently executed code in the top of the window!” …you may say. “Why would anyone need that!” …you may say. Well this brings some more details about the stack of called code and on top of that there is one thing where I have found it to be the only option to find the problematic place.
It may happen that you call a code from compiled library (you do not have a source code …it may be some third party library or just some of the basic TwinCAT libraries). And you pass an arguments that will cause an error inside the library (this has happened to me while calling some of the MEMxxx functions as I have broke my pointers during an online change). In this case the TwinCAT will not highlight the buggy line for you. It will just show nothing (except of popup asking to load source code which you do not have). Now if you open the Call Stack window you can see the exact place where this troublemaker was called in your program. So in this case Call Stack window can be used instead of stack trace.
Good night!
Leave a Reply